2019 Note
DynamicDataDisplay is now called InteractiveDataDisplay and hosted on github. I have not tried the code below on the new version.
Old Article
DynamicDataDisplay is really one of those components that make life easier for WPF programmers looking for a easy, free and performant chart.
With many functionalities integrated like a fit to view, screen shots and a quick help, it has a place in any application.
I'm crossposting the code from my answer on Stackoverflow.
To add it in Visual Studio, on the project's References folder -> Add Reference. Add the DynamicDataDisplay.dll to your project.
The namespace for DDD is Namespace: xmlns:d3="http://research.microsoft.com/DynamicDataDisplay/1.0"
XAML Used to create the graph.
 <d3:ChartPlotter Name="plotter" Background="White">
    <d3:ChartPlotter.Resources>
        <conv:Date2AxisConverter x:Key="Date2AxisConverter"/>
    </d3:ChartPlotter.Resources>
    <d3:ChartPlotter.HorizontalAxis>
        <d3:HorizontalDateTimeAxis Name="dateAxis"/>
    </d3:ChartPlotter.HorizontalAxis>
    <d3:Header Content="{Binding PlotHeader}"/>
    <d3:VerticalAxisTitle Content="Value"/>
    <d3:HorizontalAxisTitle Content="Date"/>
</d3:ChartPlotter>
The Date to Axis Converter I used for the Horizontal axis:
public class Date2AxisConverter : IValueConverter
{
    #region IValueConverter Members
    public object Convert(object value, Type targetType, object parameter, System.Globalization.CultureInfo culture)
    {
        if (value is DateTime && targetType == typeof(double))
        {
            return ((DateTime)value).Ticks / 10000000000.0;
            // See constructor of class Microsoft.Research.DynamicDataDisplay.Charts.DateTimeAxis
            // File: DynamicDataDisplay.Charts.Axes.DateTime.DateTimeAxis.cs

            // alternatively, see the internal class Microsoft.Research.DynamicDataDisplay.Charts.DateTimeToDoubleConversion

        }
        return null;
    }

    public object ConvertBack(object value, Type targetType, object parameter, System.Globalization.CultureInfo culture)
    {
        // try Microsoft.Research.DynamicDataDisplay.Charts.DateTimeAxis.DoubleToDate
        throw new NotSupportedException();
    }

    #endregion
}
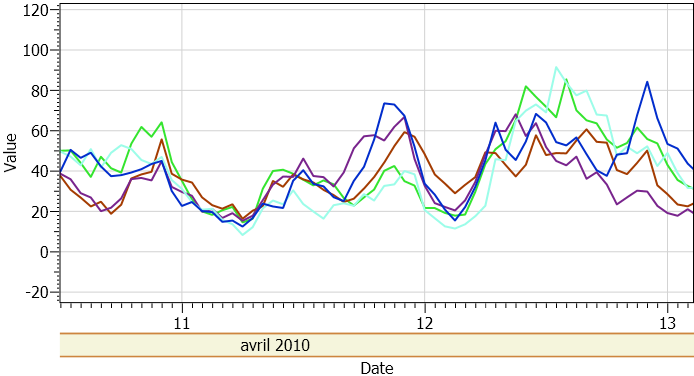
C# Code: Clearing Graph and Creating line graph, Here my StockasticProcessPoint is a structure with a field "DateTime t" and a field "Double value". Adding multiple lines gives the chart presented in the image above.
using Microsoft.Research.DynamicDataDisplay;
using System.Collections.ObjectModel;
using Microsoft.Research.DynamicDataDisplay.DataSources;

public void ClearLines()
{
    var lgc = new Collection<IPlotterElement>();
    foreach (var x in plotter.Children)
    {
        if (x is LineGraph || x is ElementMarkerPointsGraph)
            lgc.Add(x);
    }

    foreach (var x in lgc)
    {
        plotter.Children.Remove(x);
    }
}

internal void SendToGraph() {

    IPointDataSource _eds = null;
    LineGraph line;

    ClearLines();

    EnumerableDataSource<StochasticProcessPoint> _edsSPP;
    _edsSPP = new EnumerableDataSource<StochasticProcessPoint>(myListOfStochasticProcessPoints);
    _edsSPP.SetXMapping(p => dateAxis.ConvertToDouble(p.t));
    _edsSPP.SetYMapping(p => p.value);
    _eds = _edsSPP;

    line = new LineGraph(_eds);
    line.LinePen = new Pen(Brushes.Black, 2);
    line.Description = new PenDescription(Description);
    plotter.Children.Add(line);
    plotter.FitToView();
}
